Howdy doody folks. Lots of releases coming down the pipe in short order and the latest is well the latest release of the Pure Storage Plugin for the vSphere Client. This may be our last release of it in this architecture (though we may have one or so more depending on things) in favor of the new preferred client-side architecture that VMware released in 6.7. Details on that here if you are curious.
Anyways, what’s new in this plugin?
The release notes are here:
But in short, five things:
- Improved protection group import wizard. This feature pulls in FlashArray protection groups and converts them into vVol storage policies. This was, rudimentary at best previously, and is now a full-blown, much more flexible wizard.
- Native performance charts. Previously performance charts for datastores (where we showed FlashArray performance stats in the vSphere Client) was actually an iframe we pulled from our GUI. This was a poor decision. We have re-done this entirely from the ground up and now pull the stats from the REST API and draw them natively using the Clarity UI. Furthermore, there are now way more stats shown too.
- Datastore connectivity management. A few releases ago we added a feature to add an existing datastore to new compute, but it wasn’t particularly flexible and it wasn’t helpful if there were connectivity issues and didn’t provide good insight into what was already connected. We now have an entirely new page that focuses on this.
- Host management. This has been entirely revamped. Initially host management was laser focused on one use case: connecting a cluster to a new FlashArray. But no ability to add/remove a host or make adjustments. And like above, no good insight into current configuration. The host and cluster objects now have their own page with extensive controls.
- vVol Datastore Summary. This shows some basic information around the vVol datastore object
First off how do you install? The easiest method is PowerShell. See details (and other options) here:
Protection group import wizard
Assigning array features to vVol VMs can be done in one of two ways:
- Storage policies: Creating a storage policy in vCenter with a collection of advertised features from the FlashArray and then assigning that policy to a VM. The storage of that VM is then configured with those features.
- Manual tools. Manually using our GUI or scripts etc. to assign features to the volumes that represent a VM or vVol. This is useful for features that are not yet included in our SPBM capabilities but are supported for vVol volumes.
Storage policies are certainly the preferred mechanism to assign features. A significant portion of our storage capabilities are focused on protection: snapshots and replication. On the FlashArray, we exhibit snapshot or replication policies in a feature called protection groups.
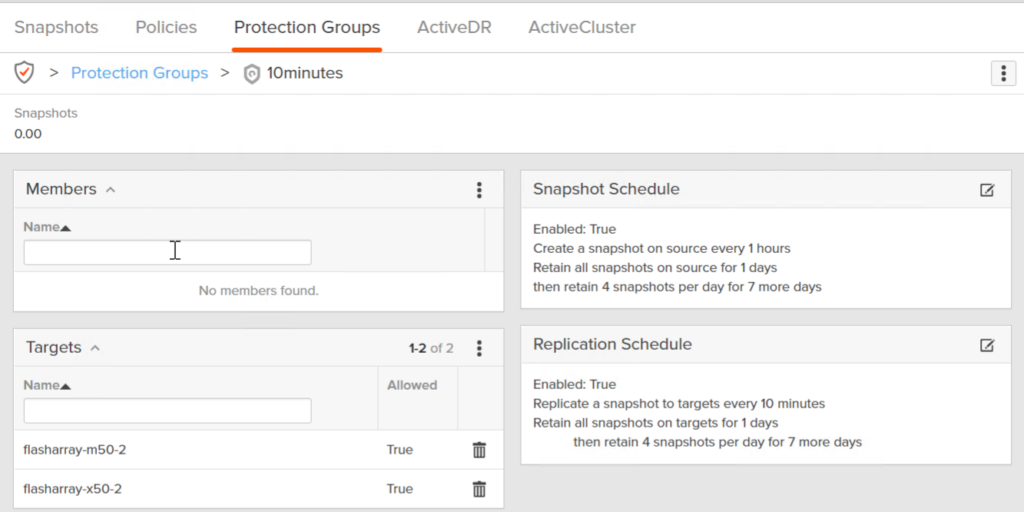
When creating a storage policy, many of the features in a protection group are surfaced up as capabilities you can choose from:
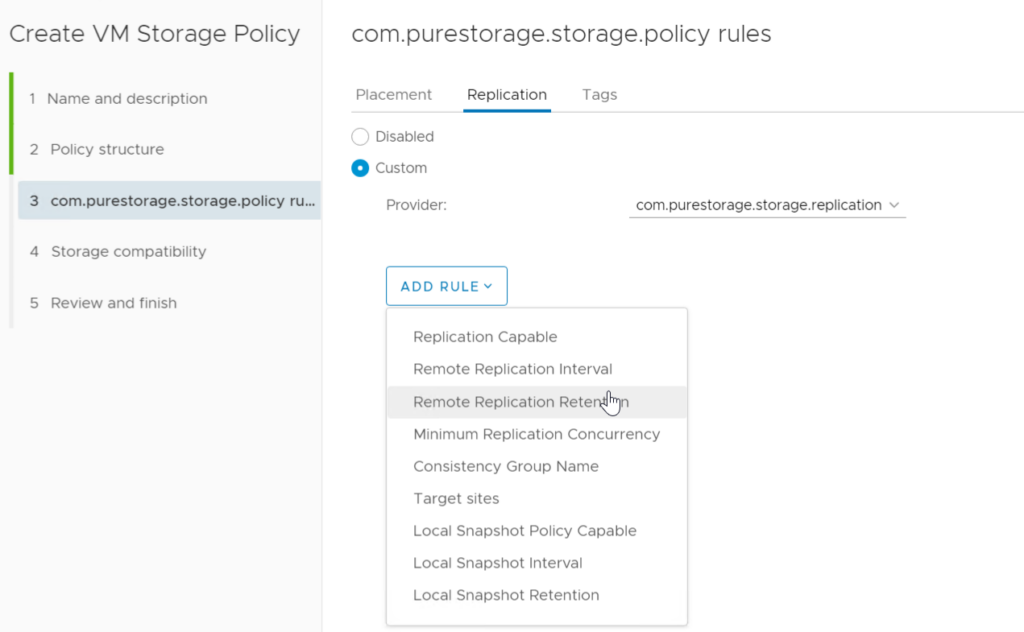
So when you assign a policy the FlashArray(s) will say who has a protection group that matches the requirements in the policy and will place them in that group. Therefore, it is helpful to have policies that actually match what is available. To help with that we have created wizard in the plugin to use protection groups as a “template” to create policies.
So let’s use the protection group above.
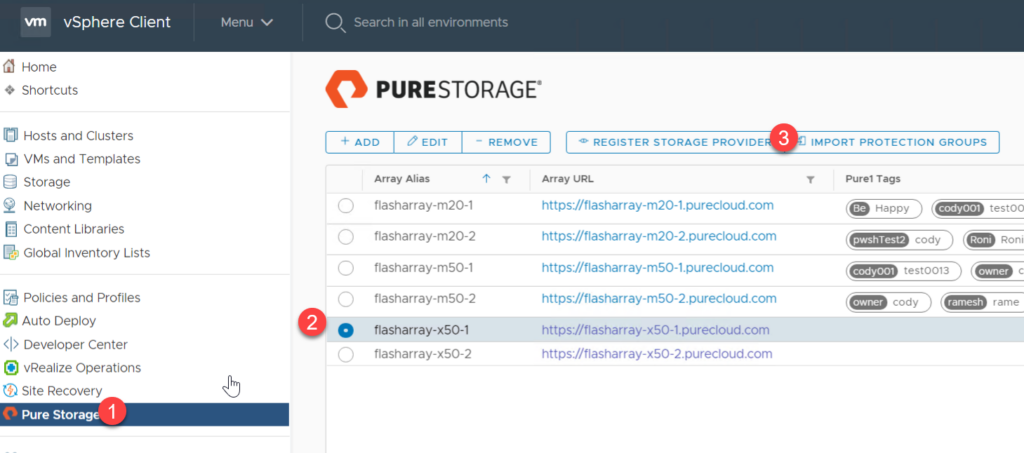
Go to the Home screen in the vSphere Client, then click the Pure Storage page, followed by an array then Import Protection Groups
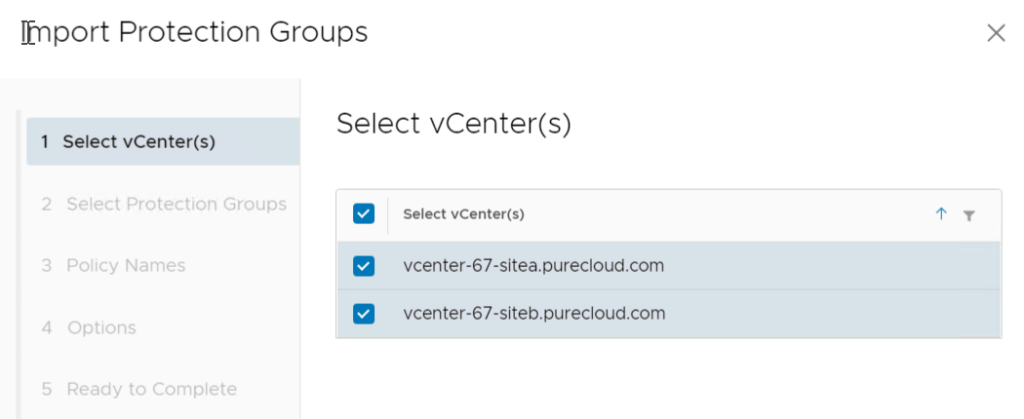
Choose the vCenter(s) you want to the policy to be created in. This will display all vCenters the current user logged in has access to. Note that a policy is created per-vCenter, so if you want the same policy in more than one vCenter you must create it in more than one. If a vCenter does not have a Pure Storage VASA provider registered in it, a Pure policy cannot be created there–so do not check that box.
Then choose the protection group(s) you want to use as a template. You can choose more than one.
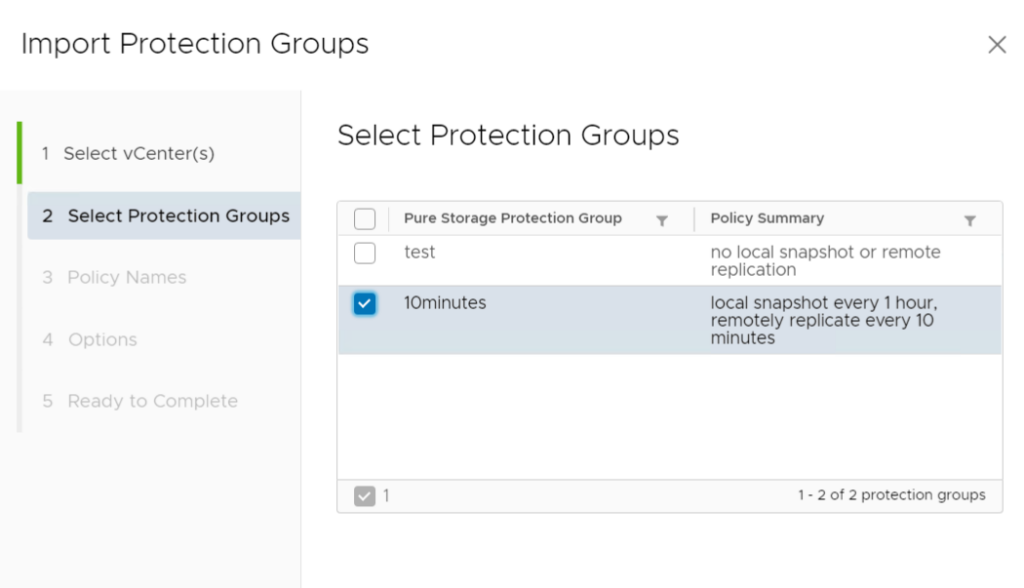
Enter the name for the policy, by default it will use the protection group name. The policy name cannot be in-use already by vCenter.
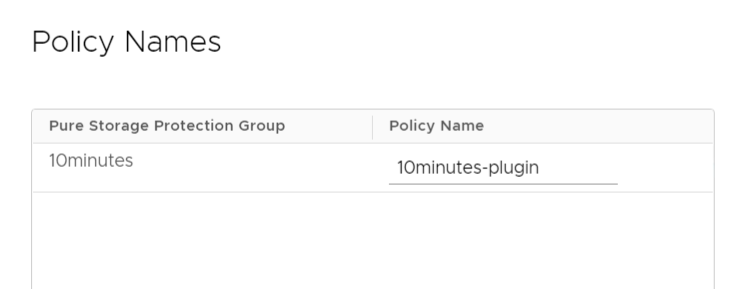
The next screen has two options de-selected by default. Require array match will force that the policy requires that any VM assigned to it be on that specific FlashArray. Keeping it de-selected will allow ANY array with that configuration to be compatible. Require protection group name match will require the policy enforce that particular protection group name. So if both are selected the policy will require THAT array with THAT protection group. If only protection group is selected, it will require ANY array with THAT protection group.
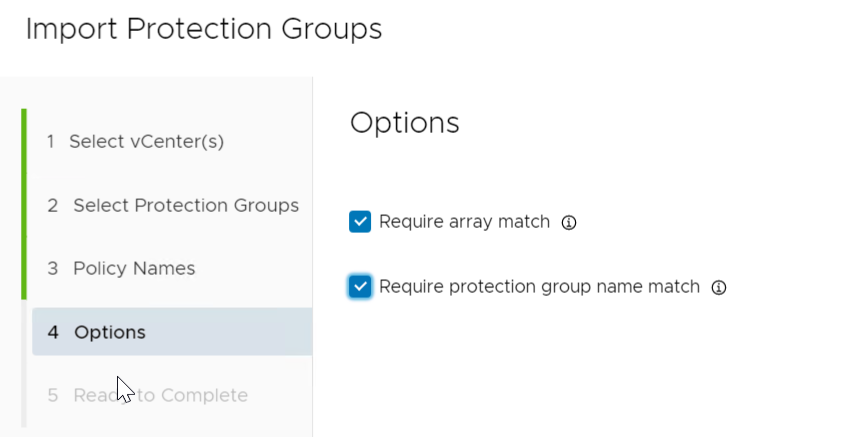
Finish the wizard. It will then create (in my case) a policy in both of my vCenters:
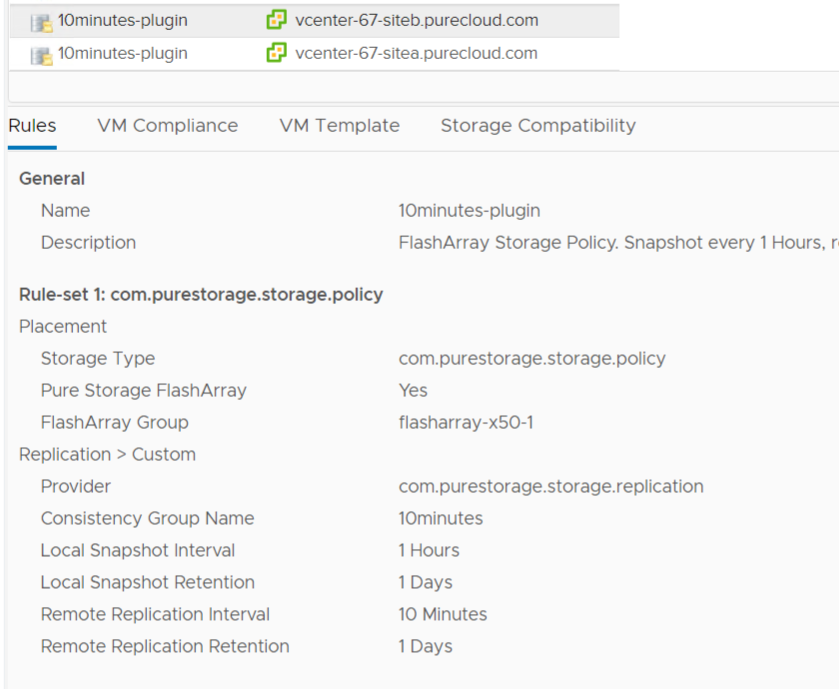
You can of course edit it for more control. We do plan to continue to enhance this wizard–certainly let me know if you have feedback.
Performance Charts
We have had performance charts in the plugin since the 1.x days of the plugin (2013-ish), but they were directly imported iFrames that led to things like this:
Yuck.
All of these performance metrics are in our REST, so there is no need for this. We added charting a few releases ago for things like the Pure1 Load Meter:
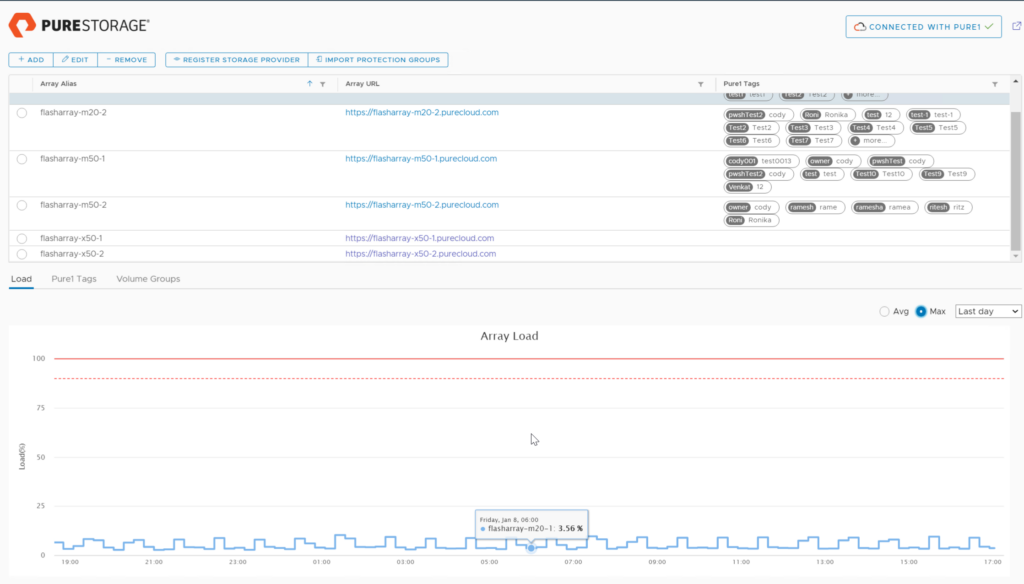
So we have done that with datastore charts now! I’ll be the first to admit–we should have done this long ago, but here we are.
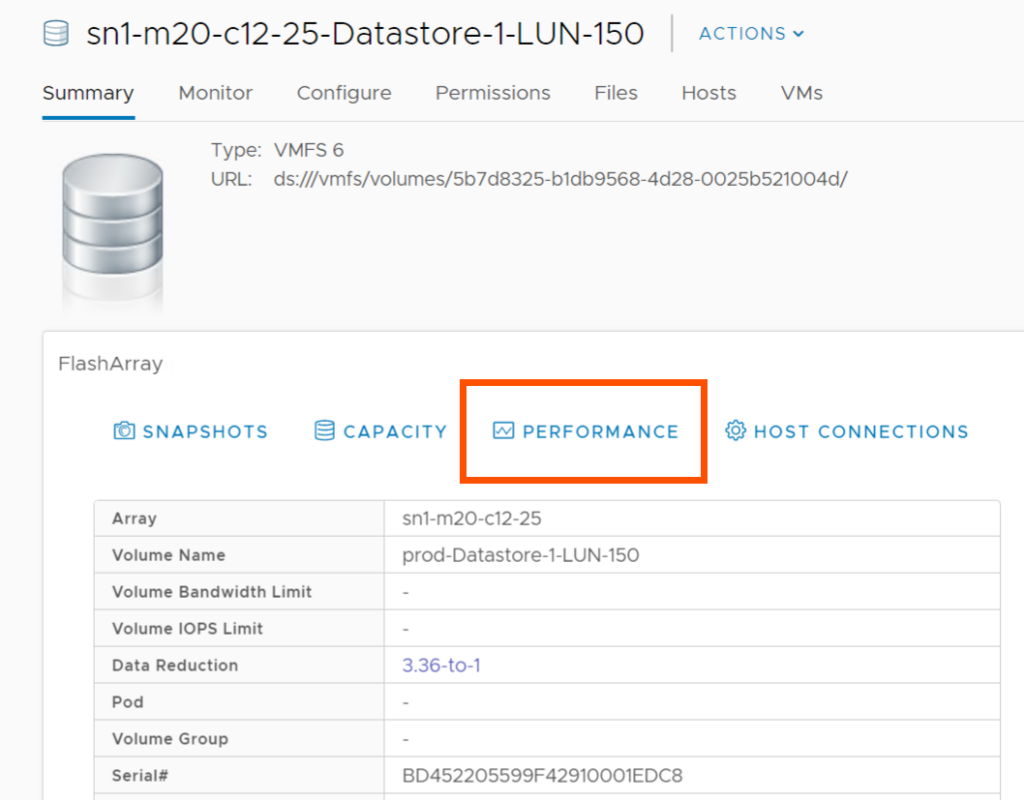
You can get to it from the summary page FlashArray widget by clicking Performance:
Or directly under Monitor > Pure Storage > Performance.
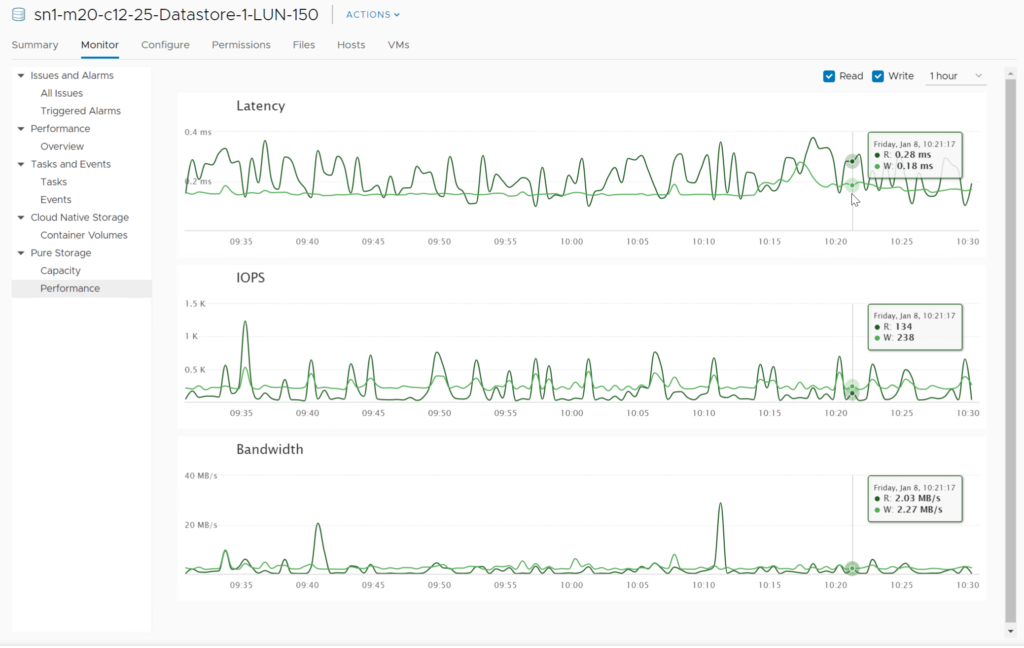
By default, it will show Reads and Writes at the 1 hour past. But this can be increased up to one year (assuming the datastore is that old).
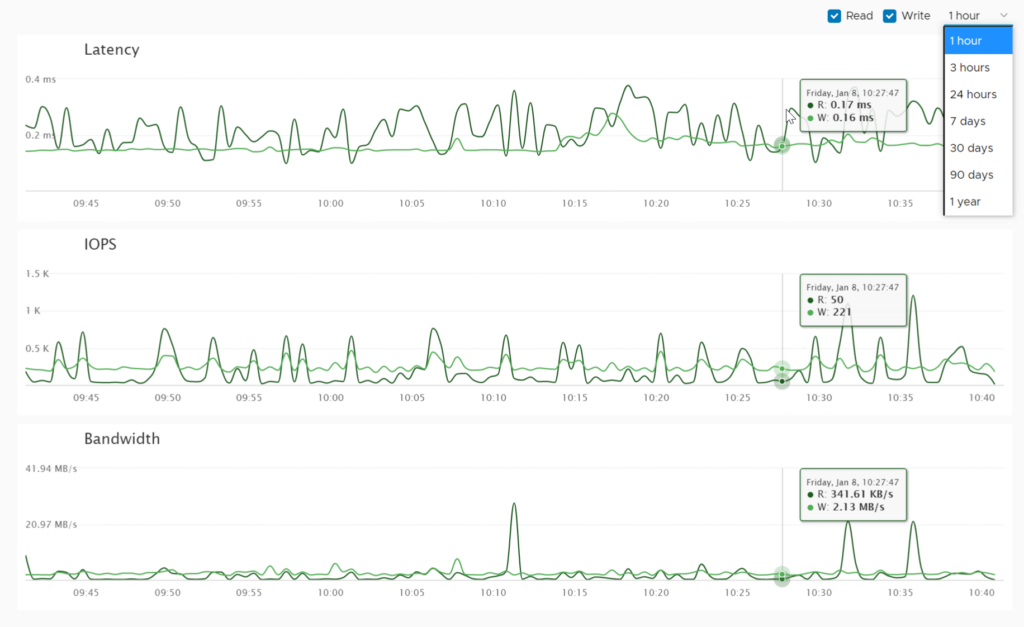
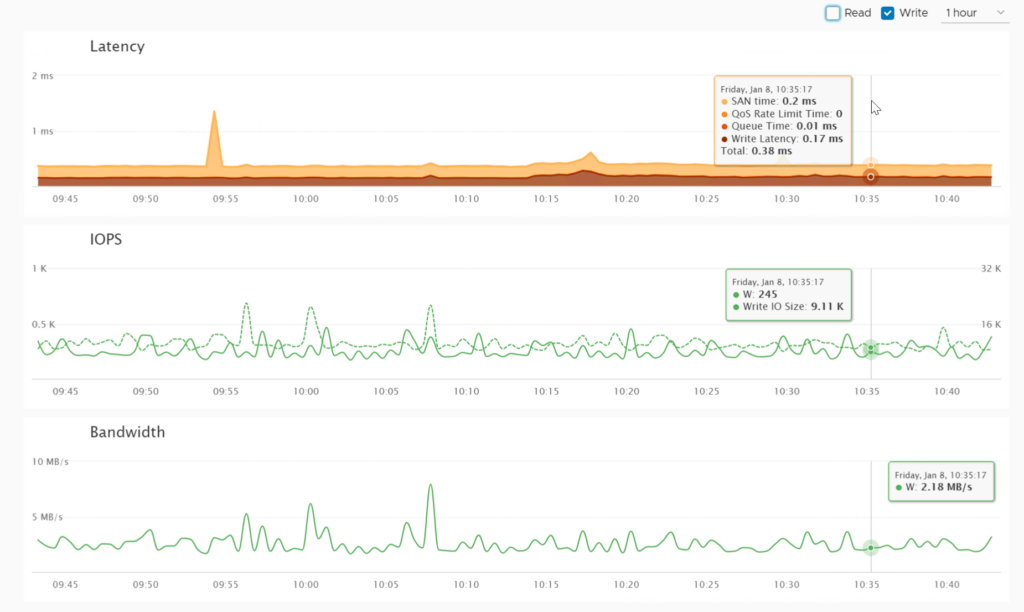
You can slide over the charts and it will report the latency, IOPS, and throughput at the time. You can also deselect reads or writes. If you do, you get more data:
WRITES:
READS:
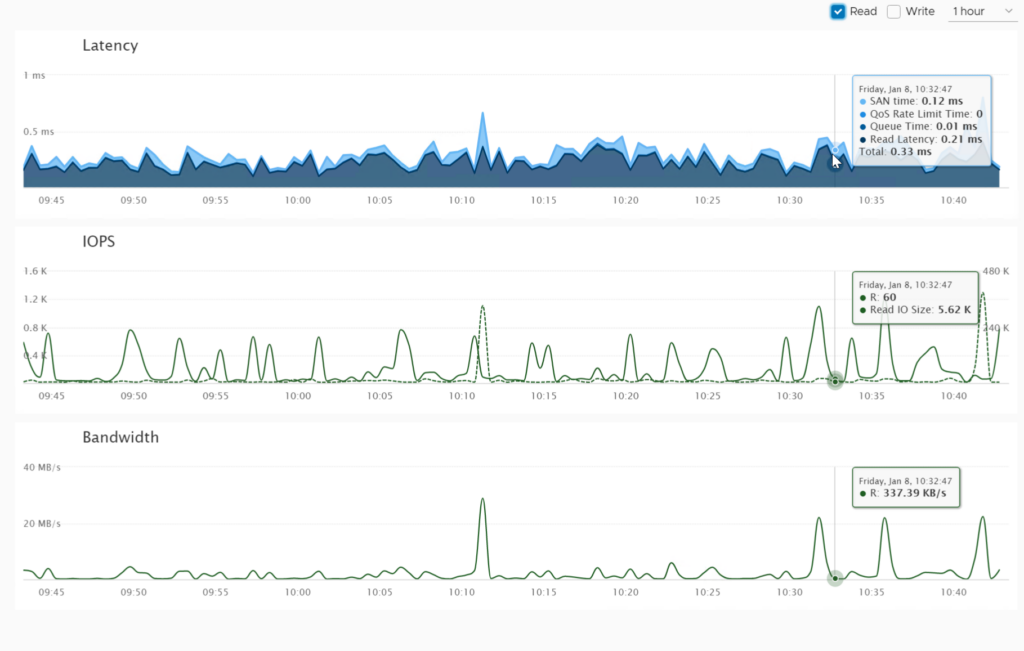
This includes things like QoS throttling time, SAN time (how long the I/O is spending between the host and the array), array queue time, and I/O size (avg).
If you have an ActiveCluster volume you will also get the mirrored writes metric:

Host Management
Prior to this release, the plugin had a “create host group” function. This did the following:
- If iSCSI was chosen, it would add the iSCSI adapter to the host (if it wasnt there), add the iSCSI target information for the chosen array, configure iSCSI best practices
- Pull initiators from the host and create a “host” object on the FlashArray with them
- It would then iterate through each host in the cluster
- Then create a “host group” so storage can be uniformly provisioned to all hosts in the cluster
The issue here was that it was fairly strict. No host could pre-exist, you couldn’t add hosts or remove hosts, name collisions could occur etc. If provisioning failed you had no idea why without going to the array. You didn’t know what was create specifically on the array. Etc.
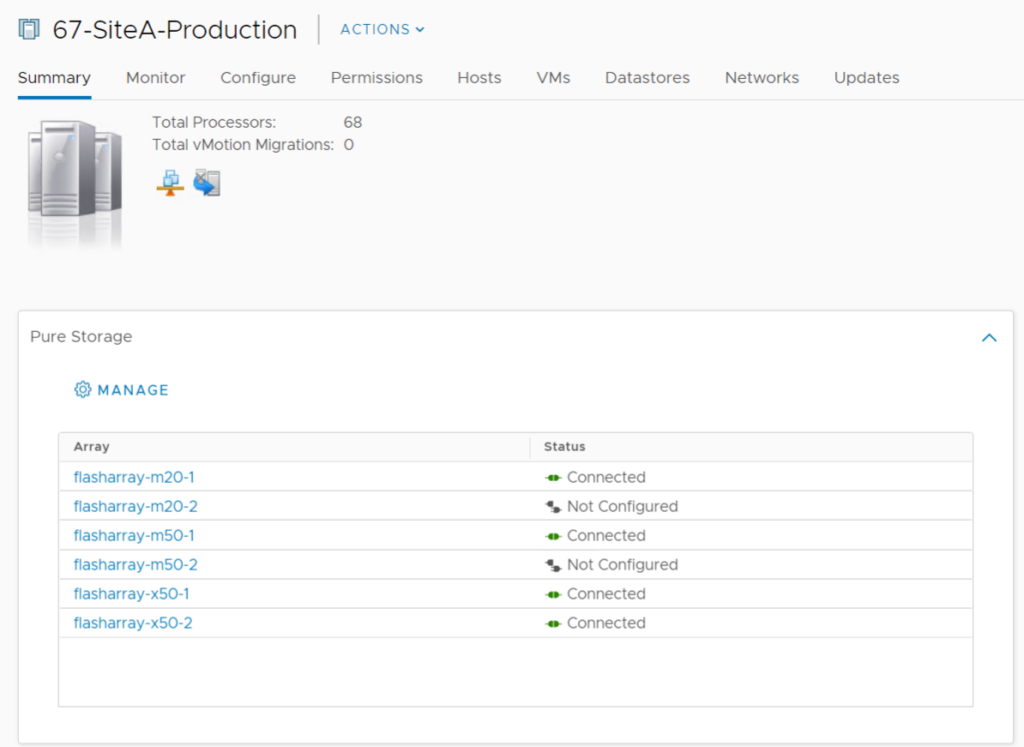
So we added a new panel. This can be accessed from the summary tab FlashArray widget from the cluster or host object and clicking on Manage or by clicking on the array–it will make sure the page appears with that array selected. This summary will tell you what arrays (registered with the plugin) this host or cluster is configured on.
Or directly by click on the host/cluster then Configure > Pure Storage > Host Connections.
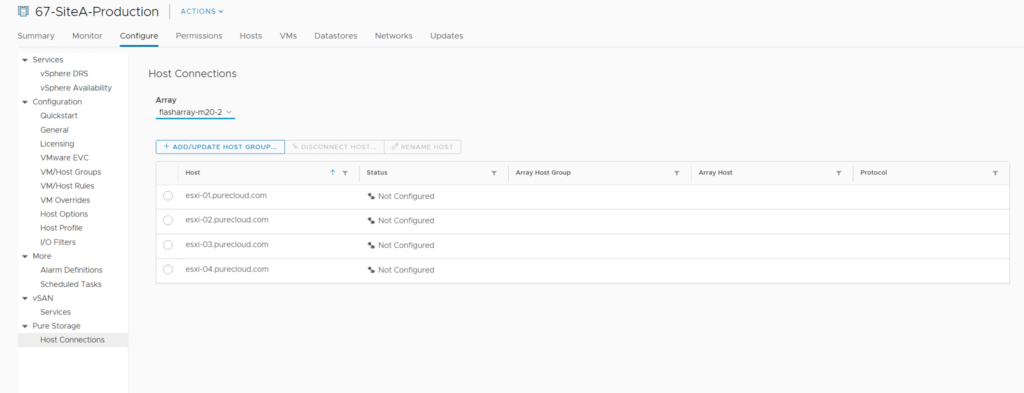
You can choose the array you want by choosing it in the drop down.
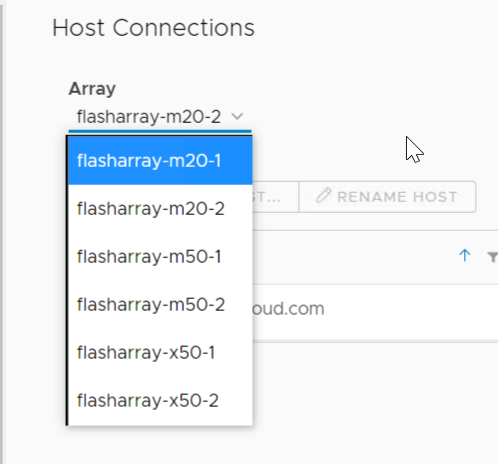
- Host: This is the network address of the ESXi host
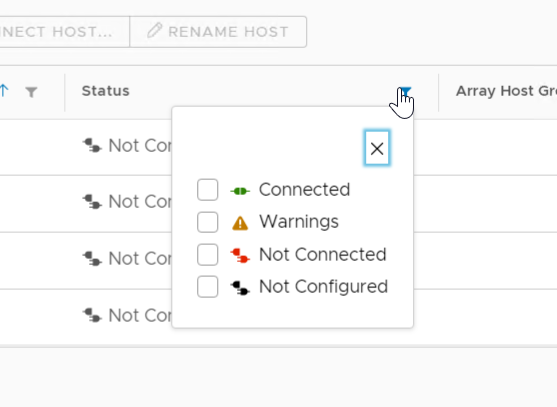
- Status: This indicates the configuration status of the host. The following are valid options:
- Connected: This means that the ESXi host has a corresponding host object for that protocol on the array and the FlashArray sees it as online.
- Not Connected: This means that the ESXi host has a corresponding host object for that protocol on the array but the FlashArray DOES NOT see it as online. This means the initiators are on the FlashArray, but connectivity is down. So for Fibre Channel this could be a zoning issue, and for iSCSI this could mean the hosts are not configured correctly or that there is a networking issue.
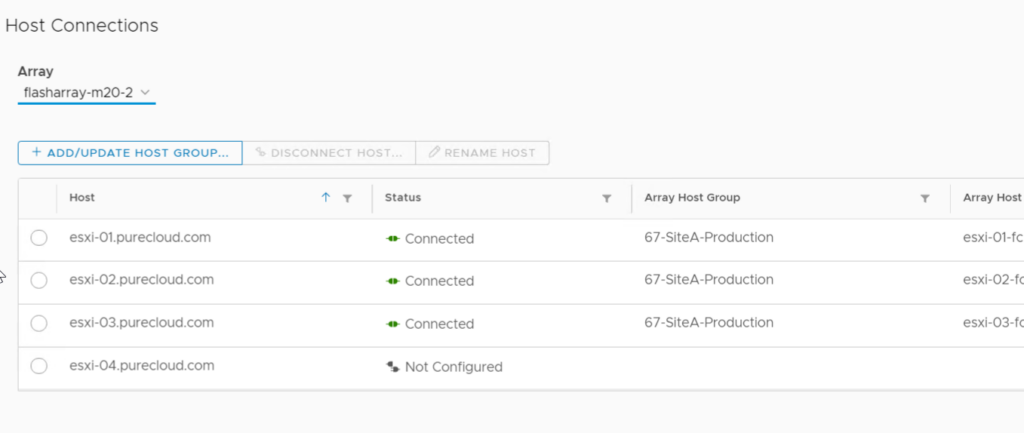
- Not Configured: This means that the ESXi host does not have a corresponding host on the FlashArray at all.
- Array Host Group: The name of the host group on the FlashArray that the corresponding host is in. For clustered hosts it is recommended to always put a host in a host group.
- Array Host: The name of the host object on the FlashArray for the corresponding host.
- Protocol: FC or iSCSI
All of these can be filtered:
To create a host group, click the Add/Update Host Group button.
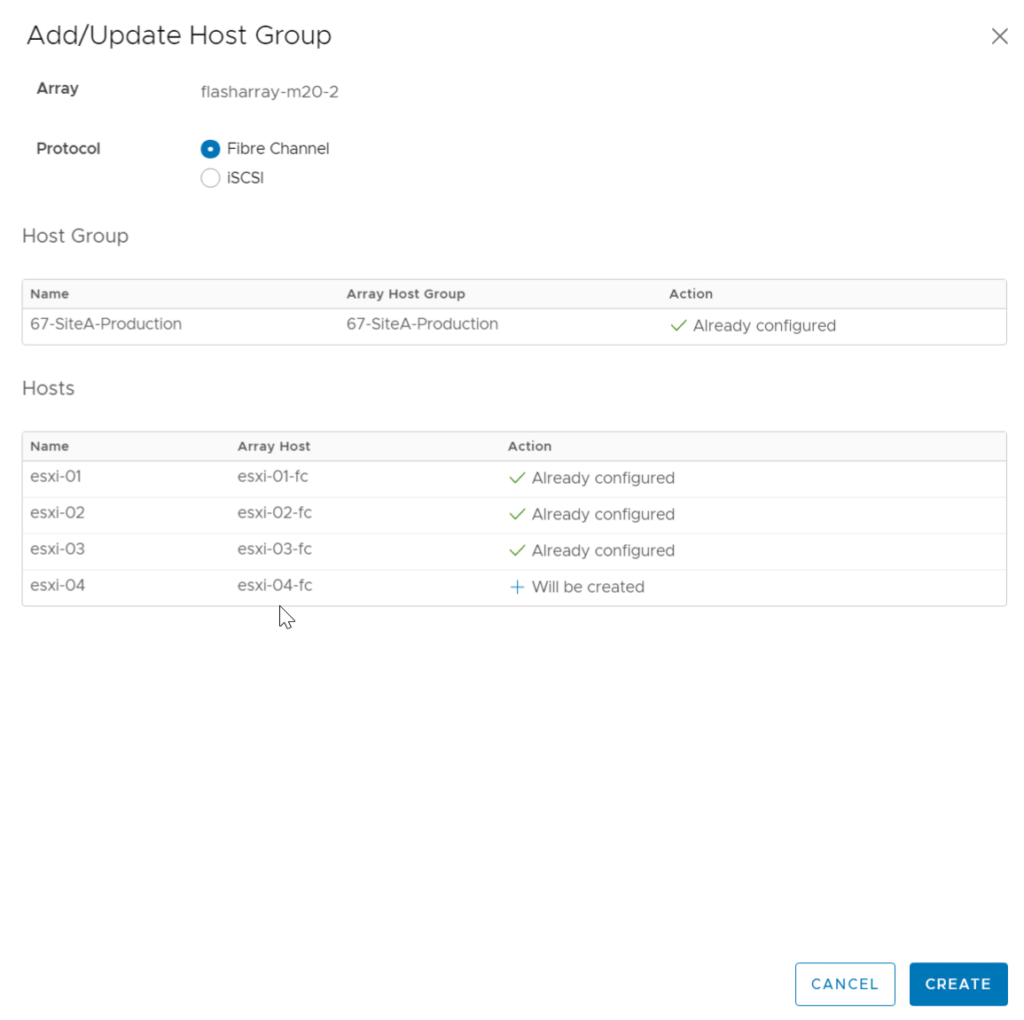
This will look on the array and choose names and figure out if the object has already been created or not.
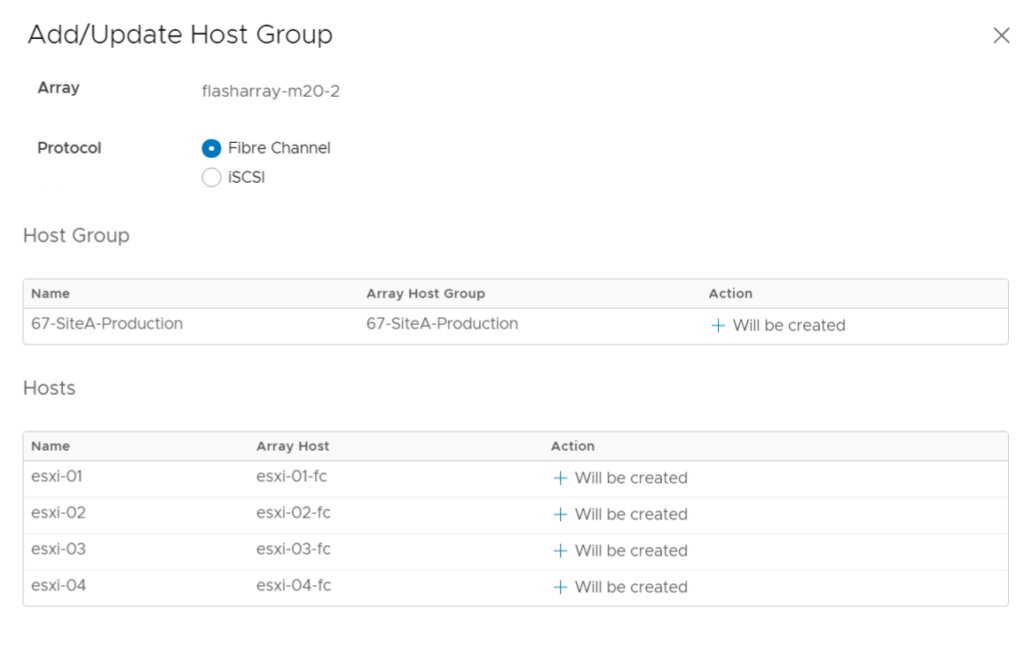
Once done, click Finish.
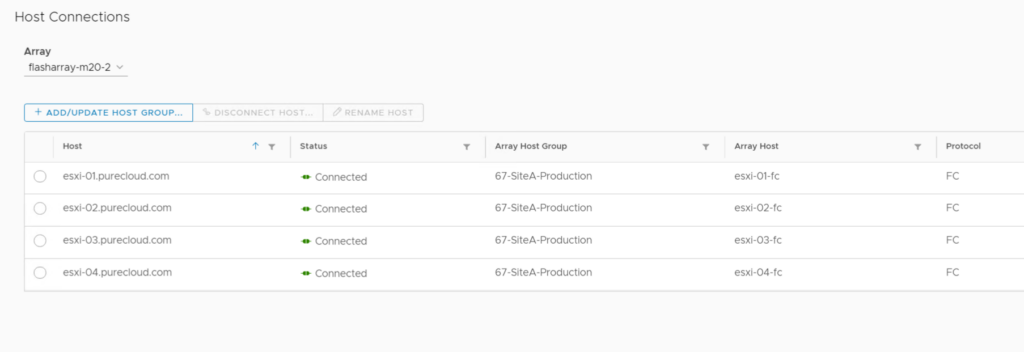
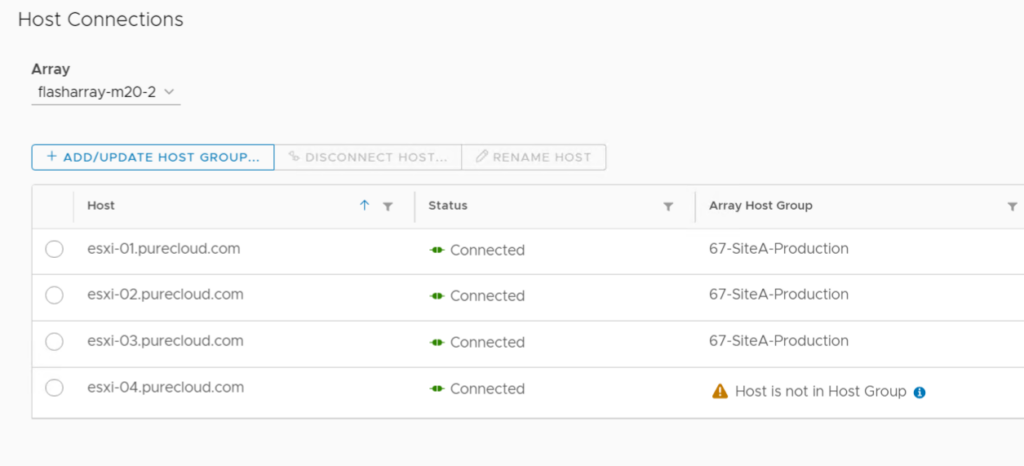
If a host is created, but not in the host group you will see this:
If it is not created, you will see this:
So to add that new host (or the host that is created but not in the host group), run the add/update host group wizard and the new host will be listed as “will be created”. The others will be marked as “already configured”.
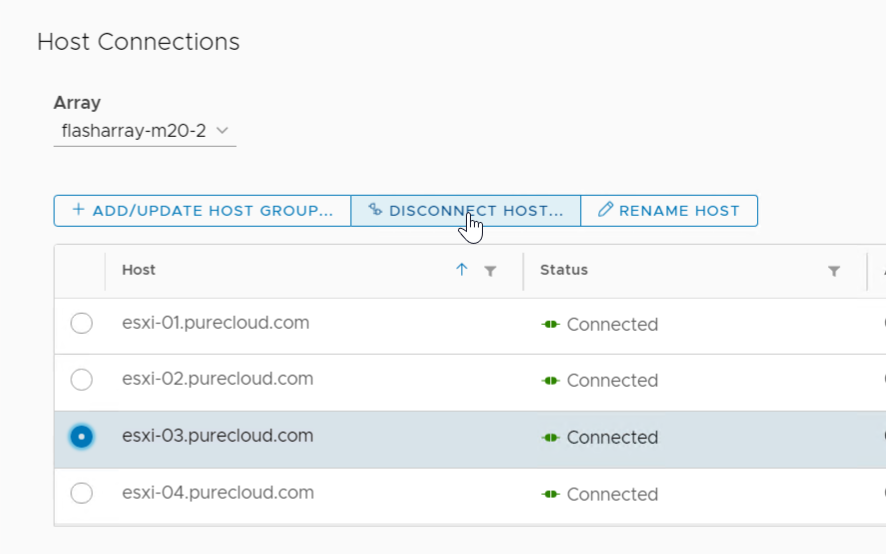
To remove a host, select it and choose Disconnect Host.
To rename it, choose Rename Host.
We have some required today though that will be eventually removed on the following workflows:
- Add existing host to host group
- Disconnect host
They require the host to be in maintenance mode. We did this because in order to safely change connection information we need to ensure that it is not using storage from that host, and ideally automate the removal of the storage first. So in order to get the release out we put the maintenance mode restriction on these operations. In a future release we will likely relax and/or remove this requirement as we enhance the intelligence of the workflow.
Datastore Connections
In a similar vein, once these connections are made you can provision and de-provision datastores from them.
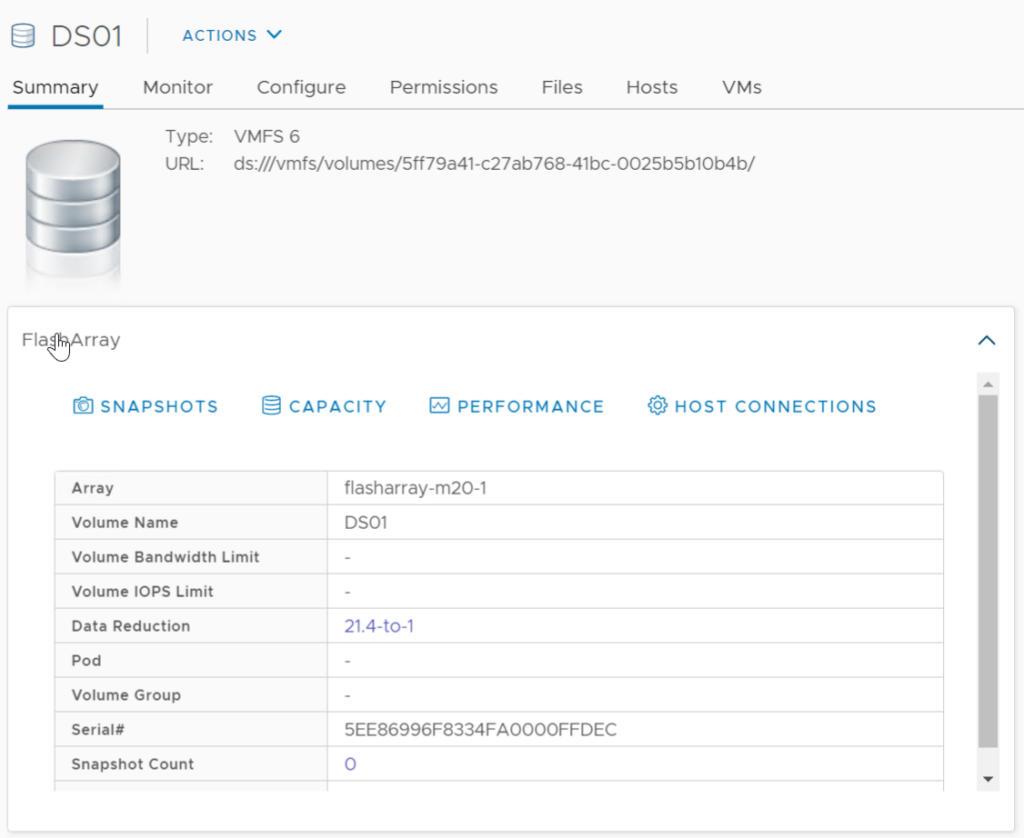
To get to this screen either click on the datastore tab and then the summary tab FlashArray widget and finally Host Connections:
Or the Configure tab > Pure Storage > Host Connections.
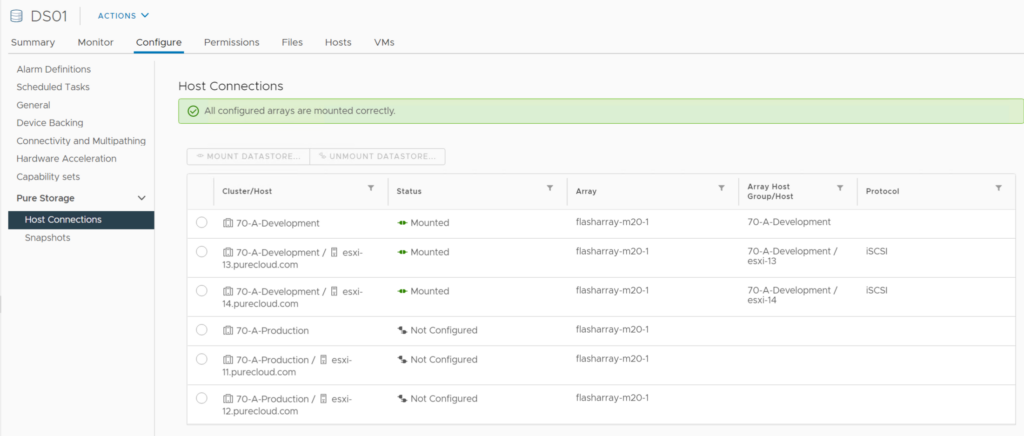
This screen shows a few things
| Column | Description | Filter |
| Cluster/Host | This is the name of the ESXi host or Cluster and in the case of a host the cluster is belongs to if it is in one. A host could be listed twice if it has two objects on the FlashArray (for instance one FlashArray host for iSCSI and one for Fibre Channel). | You can filter by the name of the host or cluster |
| Status | Information about the host connection in general or the datastore connection status to that host. Possible values are: Mounted (properly and fully connected to this object) Warnings (there is some issue on this host or cluster or a host in the cluster). Not Connected (the host is configured on the FlashArray but the connection is not online) Not Configured (the host is not configured on the FlashArray) Not Mounted (the host is configured and online with the FlashArray but the volume is not connected to it) | You can filter by the status of the hosts or cluster connection with the datastore. |
| Array | The name of the array(s) that host that volume. In the case of ActiveCluster this will be two arrays. | You can filter by array name. |
| Array Host Group or Host | The name of the host or host group object that corresponds to that host or cluster. | You can filter by the host or host group name. |
| Protocol | The in-use protocol (iSCSI, Fibre Channel, or NVMe-oF) for that host. | You can filter by iSCSI or Fibre Channel. NVMe filtering is forthcoming. |
To add to another cluster or host, choose it and click the Mount Datastore button.
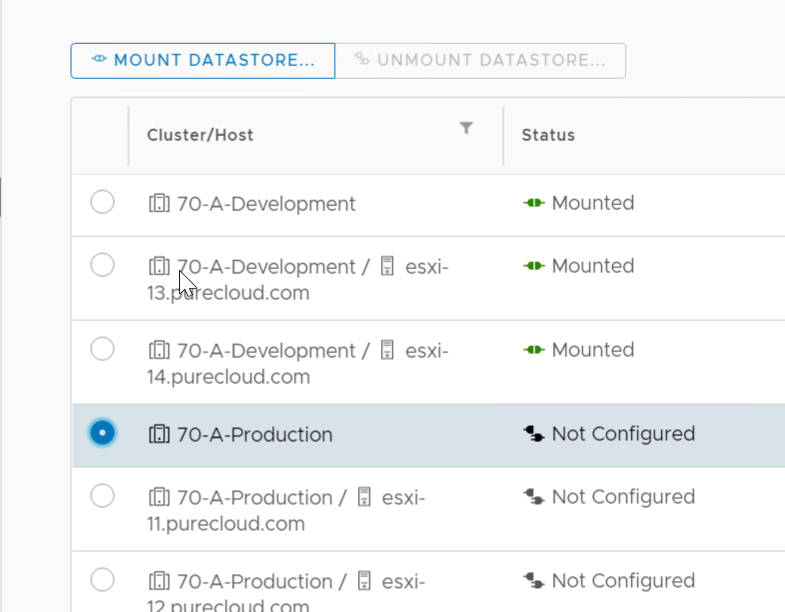
If the host or cluster is not configured it will show a link to the configure screen.
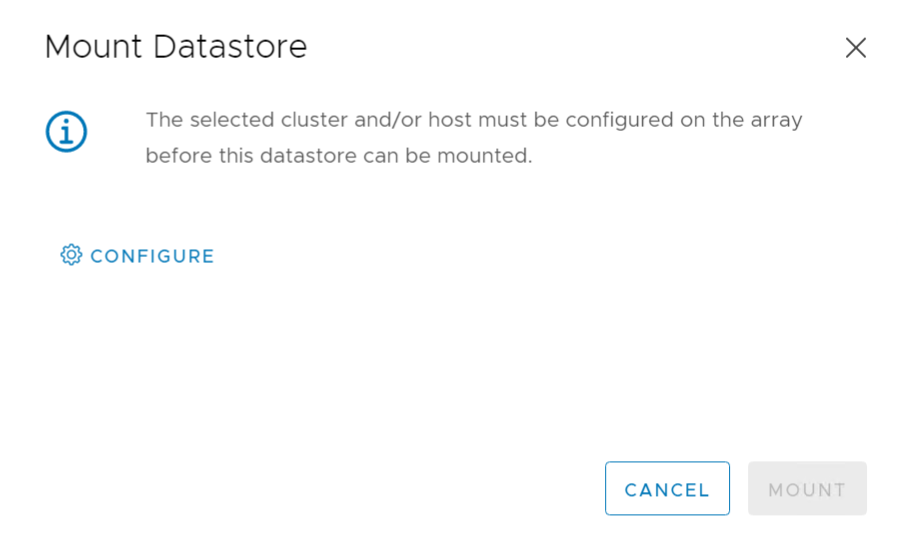
If it is, you can then mount.
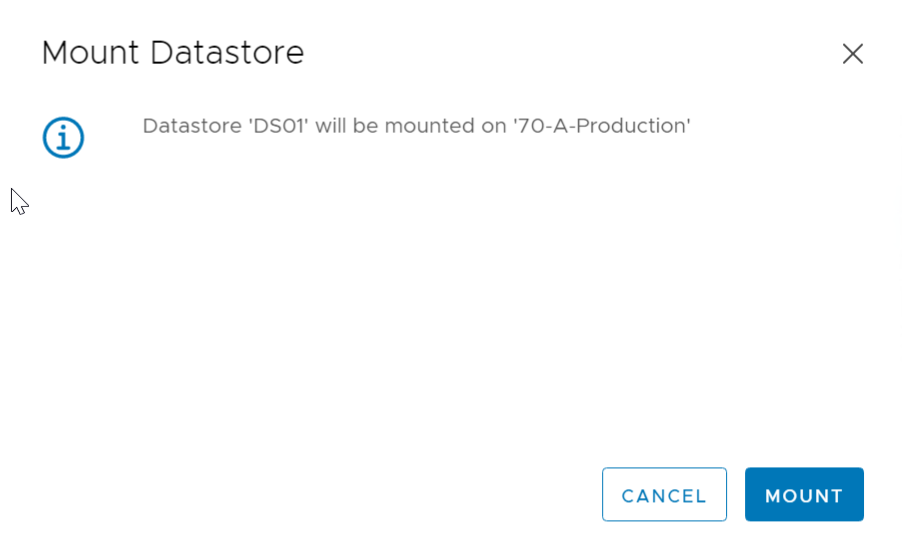
This will add it to the host group or host and then rescan/mount the datastore. Unmount will do the opposite. Note that we will not allow you to connect a given datastore to hosts via more than one protocol. That is not a supported configuration by VMware.
vVol Datastore Info
Lastly, some more information on vVol datastore objects. When you click a vVol datastore, you will see a new FlashArray widget on the summary tab:
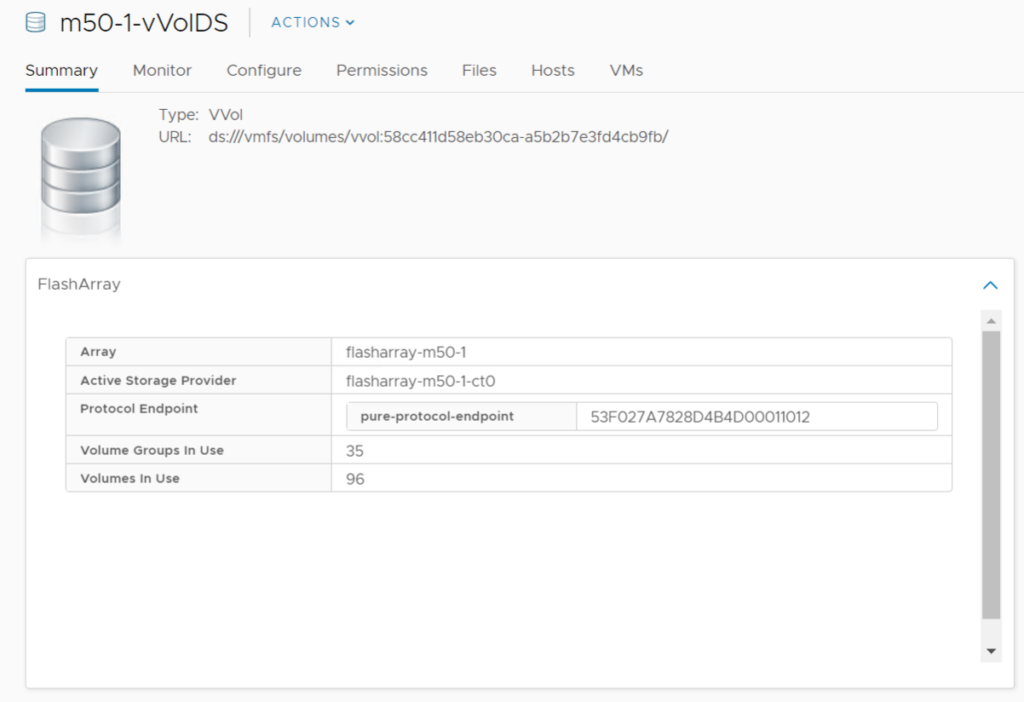
This will show the VASA provider in use as well as the array, available protocol endpoints, and how many volumes (vVols) and volume groups (VMs) are consumed by that vVol datastore.
If this is more than that vCenter says, it means that the datastore is in use by more than one vCenter, or there are some unregistered VMs on that datastore.
We plan on A LOT of enhancements with this. For the most part, almost all new features moving forward will be vVol focused. 2021 should be a fun year for our integration!
Enjoy.
The user guide is here:
And if you have feedback use our Slack team where you can self-register at code.purestorage.com.

any dependencies on Purity version minimum needed for the new plugin?
Purity 4.10 and later, though certain vVol features need 5.3.x+
Unfortunately the new plugin doesn’t show performance nor capacity metric for vvol datastores on Pure… 🙁
We are actually putting a lot more thought into vVol performance reporting. Because a vVol datastore is so fundamentally different than a VMFS datastore, performance reporting isn’t particularly useful on a vVol datastore. We might add that at some point, but it is not the priority right now. Our focus for an upcoming release is performance reporting on the VMs themselves–so similar charts to VMFS, but per-VM if it is a vVol VM.
Capacity metrics though are natively reported–so what VMware shows it what we tell VMware is in-use etc–something that isnt possible with VMFS. So vVols solves that intrinsically. I’d be curious to hear what you would like to see more around capacity reporting for a vVol datastore, as we can certainly add some features.
Regarding performance metrics – it still would be nice to see total IOPS, throughput, etc. generated against a vvol datastore for all vvols objects there. The Pure Plugin does present it for vmfs datastores, but not for vvol ones. If I login to the Pure Array I can see array wide stats, but if we are serving both vmfs and vvol datastores, it’s hard to get vvol wide stats onl. Per vmfs is easy as it is presented both via the plugin to vmware but also on per volume basis where volume is usually a single vmfs datastore. With vvols to get an over-all stats it is currently hard to do. One can’t even select all vvol* volume groups on the array for analysis/performance tab as there is a limit of max 5. Even if one could there is no option to stack graphs, and without it that wouldn’t give overall view. There are multiple reasons why overall vvols perf. stats are useful, for example: when migrating all VMs from a given vmfs datastore to vvols, I would like to compare before and after migration. Or would like to see trends for all vvol based VMs on a given arrays. Currently can see trends for entire array or per vmfs datastore, but not for all vvols.
Then as you mentioned, exposing per VM perf stats via the plugin to vmware so it shows up in Monits/Pure/Performance for a given VM would be a nice touch (although one can get them directly from a given array).
Regarding capacity – for vms the plugin presents stats like Use, array host written, array unique space. For vvols pluging doesn’t present anything and vsphere itself just shows total 8PB size and used space (I guess from vmware perspective, so before dedup&compression?). One can’t easily tell when using vvols how well data reduction works for VMs on vvols. This would be good to know as overall stats (across all vvols) and to some degree per VM as well, which should be easy for the compression bit but not necessarily for dedup.
I guess my thinking here is that with vVols, management/reporting is far more VM centric and since a vVol datastore is just a capacity limit, performance isn’t particularly meaningful (or actionable) metric for it. But for a given VM it is–as VMware has per-VM stats and we also now have our own per-VM and per-disk stats (as well as capacity though more on that in a bit). Furthermore there shouldn’t be an aggregate performance difference between VMFS and vVols (with this exception https://www.codyhosterman.com/2017/11/do-thin-vvols-perform-better-than-thin-vmdks/) so before/after shouldn’t be too helpful either, especially since people tend to consolidate many, many, VMFS datastores into one vVol datastore. So I tend to think we can add a lot more value by focusing on the per-VM object/reporting today.
When it comes to capacity, there actually isn’t such a thing as VMware metrics on a vVol datastore (I go into detail here https://www.codyhosterman.com/2018/03/vmware-capacity-reporting-part-iv-vvol-capacity-reporting/). All of the metrics (size, usage, provisioned, written all are actually directly reported to VMware from our array via VASA) So for similar reasons to performance, what metrics are more important and where we can add value changes. In capacity, VMware actually already has a lot of our numbers, on both the individual VM and datastore–which is one of the intrinsic values here.
But with that all being said, your concern is duly noted. Especially once we add multiple vVol datastores soon this will become more important. So we will keep this in mind for then. I will also note that a lot of this information is already in Pure1 VM Analytics (capacity now and performance). We are also adding vVol support to our new vROPs mgmt pack that should be out shortly. For the short term, our plans around vVols in the vSphere Plugin are focused on per-VM perf/capacity metrics (real time and historical) and general vVol VM management improvements.
After upgrading to 4.5.0.
There was a problem retrieving pods from the arrays. Pods will not be available for this datastore.
What could be the problem?
After installing the plugin I got the following error.
There was a problem retrieving pods from the arrays. Pods will not be available for this datastore.
Hmm. Not sure, can you open a support case with Pure so that we can take a look?
Ok, i will open a support case.