Hello- my name is Nelson Elam and I’m a Solutions Engineer at Pure Storage. I am guest writing this blog for use on Cody’s website. I work on Pure’s vROps Management Pack.
With the introduction of Pure’s version 3.1.1 Management Pack for vROps, we now have the ability to monitor vVol VMs and datastores. We’ve updated the user guide here with the new vVol content but I thought it would be nice to cover some of this on this blog as well.
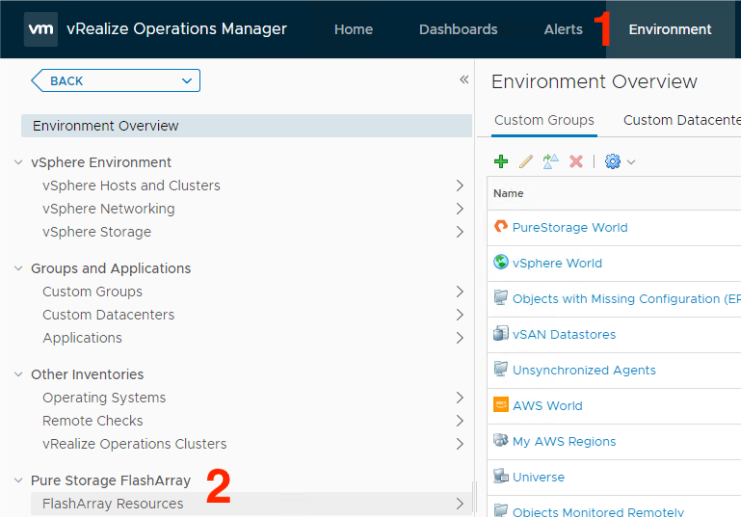
The big feature to come in 3.1.1 is the ability to monitor your Pure-hosted vVol VMs and the volumes backing them. To see some examples of this after installing 3.1.1, first you’ll want to click on the Environment tab then click on FlashArray Resources on the left hand side:

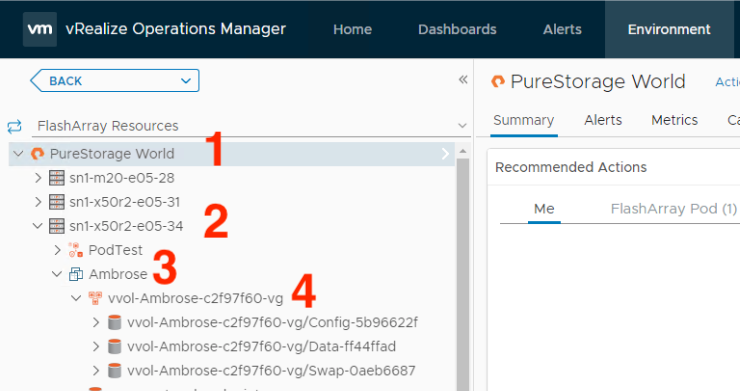
Next expand PureStorage World, the array your Pure-hosted vVol VM is on, then your VM name, and finally expand the volume group (suffix of -vg unless someone has changed it on your array) to see the volumes backing that VM. There are other ways to navigate to the same objects from this list but I find this way to be the most intuitive.

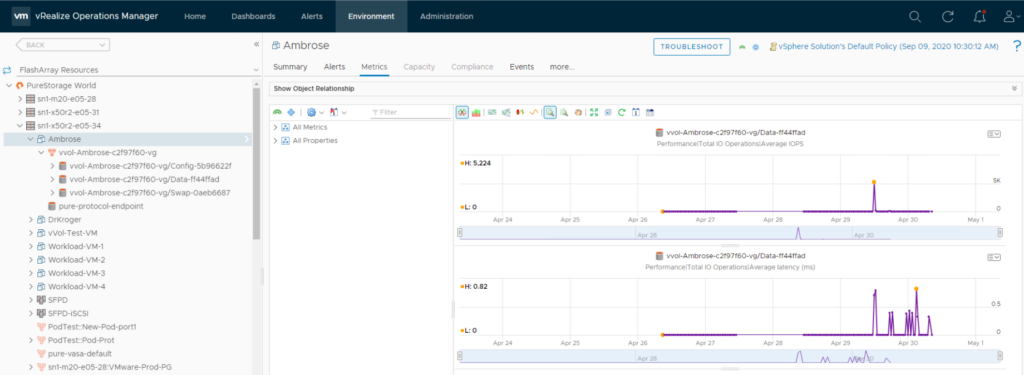
For my example, I’m going to focus on the only data volume connected to this VM because that will be more interesting to me from a performance perspective. This volume is where the OS for this VM lives.
Looking at our VM, I’ve focused on Average IOPS and Average Latency (ms). Using the default view, we can see that on April 29th, we had a spike in average IOPS to 5224; this was when I powered on this VM. Otherwise, IOPS are really low on average. Looking at latency on this volume, we can see it peaks at .82 ms and generally stays below .5 ms.

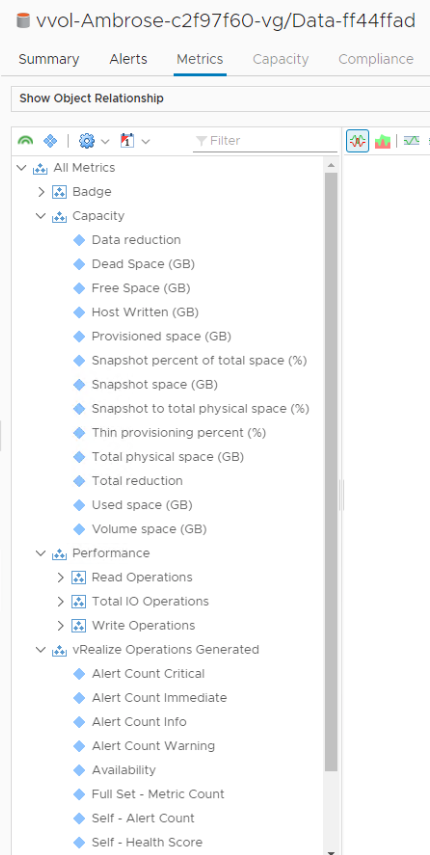
There are many other metrics available to us on these vVol volumes, but you might recognize them because they are the same as any other volume on a Pure Storage FlashArray!

Thank you for taking the time to read this- I hope you found it helpful.
